Dapfor .Net Grid Introduction
Part1: Data Types
Part2: Data Binding
Part3: Event-driven model
Part4: Data formatting and presentation
Part5: Threadsafety
Part6: Threadsafe BindingList
Part7: Appearance and painting
Part8: Cell highlighting
Part9: Data filtering
Part10: Data sorting
Part11: Data grouping
Part12: Headers and columns
Part13: Editors
Part14: Performance. Practical recommendations
Part15: Real-time blotter
Part16: Currency converter
Part17: Instrument browser
Part18: Order book
Part19: Basket Viewer
.Net Grid Tutorial Part 15: Real Time Blotter
As a tutorial, let's review development of an application that displays data that changes in real time. Let's pay special attention to application architecture, its performance, memory consumption and thread safety. As a basis we shall take a significantly simplified trading application with typical screens that display data updated in real time.
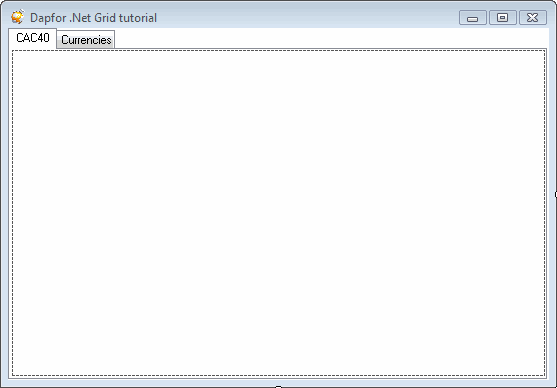
First of all let's create a new project and call it Grid.Tutorual. We shall add a TabControl with CAC40 and Currencies pages to the basic form and will use this control for examples.
To go ahead we have to review application business model. For this purpose we shall create Market class that may have numerous parameters such as name, closing and opening time, working days, state, etc. For the sake of simplicity we shall use only name, state and closing/opening time. Every market has a set of instruments that it supports, i.e. shares, bonds, CDS, etc. Instruments are usually obtained before opening of a trading session and remain unchanged for the entire working day. Every instrument has its identifier (or multiple identifiers). For our purposes we shall use shares with ISIN code, mnemo and some other parameters. Specifically, if instruments are so called blue chips (i.e. most quoted instruments), they may form an Index (e.g. NASDAQ, SBF100, CAC40 etc) and specify their weight in this index. When an instrument is sold or purchased at the market, the application gets notified of this event. Let's create Feeder class that will contain information on quoted instrument, market information, price information (maximum and minimum price), price change history and information on product availability at the market. Let's note that feeder values can be changed in real-time and often in non-GUI thread. In general case class chart will look as follows:
Let's note that Feeder class implements INotifyPropertyChanged. This enables it to notify subscribers of instrument market price changes.
Trading application may work with multiple markets and instruments simultaneously and this information should be accessible to the entire application. Markets or instruments can be added or removed during the course of work of application. To store a list of instruments, markets and other global information we shall create Provider class and fill it with data similar to actual. Once again we have to point that this data is simplified, but this tutorial still demonstrates application development, principles of separating data from presentation and place of .Net Grid in the application.
When we have created a data model, let's display it. For this purpose we shall create CAC40Control class and place this control to TabControl. After that we shall add Dapfor.Net library to the project and place the grid inside newly created CAC40Control. For grid configuration you can open Dapfor .Net Grid designer that is accessible from the context menu or by right-clicking in top right area of the grid in design mode.
So, we have configured grid in the designer. Now we can connect data from provider to the grid.
 	public CAC40Control()
{
    InitializeComponent();

    grid.DataSource = Provider.Instance.Cac40Feeders;
}
Upon first launch of the application we see the following:
As we can see at the picture, the instrument column displays nothing. This happens because this column has InstrumentId identifier, while Feeder doesn't have such field. Of course, Feeder class has a reference to Instrument class object and a new property can be added to Feeder, but this is not the best solution for the following reasons:
It is necessary to change business model and duplicate Instrument information in Feeder class solely for the sake of displaying data
If Feeder works with instruments of different types, it becomes necessary to add data type verification logic to InstrumentId property.
When there are many duplicate fields, Feeder may become barely readable.
The .Net Grid provides much simpler solution – use of composite objects. The idea of such objects is simple: combining properties of the composite object and of the object returned by composite property. In other words, if Feeder references Instrument, properties of these two classes may be combined and the grid shall see properties of two objects at the same time. Composite properties are marked with CompositeFieldAttribute attribute that doesn't impact application business logic. Let's note that we don't add a single line of code that may somehow modify relation Instrument and Feeder. This attribute is solely a flag that makes the grid to interpret Feeder object in a special way. Let's note that Instrument class also doesn't contain InstrumentId property. FieldAttribute object can be used to set this property.
public class Feeder : INotifyPropertyChanged
{
    private readonly Instrument _instrument;
    ...

    [CompositeField]
    public Instrument Instrument
    {
        get { return _instrument; }
    }
}

public class Instrument
{
    ...

    [Field("InstrumentId")]
    public string Isin
    {
        get { return _isin; }
    }
}
Now the grid will display ISIN code of the instrument. In other types of instruments it is possible to mark any other property with InstrumentId identifier, enabling a sort of polymorphism. Let's follow the same sequence of actions for Market object stored in Feeder:
public class Feeder : INotifyPropertyChanged
{
    private readonly Market _market;
    ...

    [CompositeField]
    public Market Market
    {
        get { return _market; }
    }
}
Now it is feasible to add animation to our application and modify data in non-GUI thread. For these purposes we shall add BeginUpdates() method to Provider class. This method initializes timer that arbitrarily updates Bid, Ask, Last values, available buying and selling methods and feeder state every 10 msec. After implementation of changes the application shall look as follows:
Let's note an important detail: the grid gets notifications via INotifyPropertyChanged interface. All notifications arrive in non-GUI thread. The grid synchronizes with the main thread and processes notification. All calls of Feeder & Instrument object properties are made in GUI thread.
Now let's work on application appearance. We shall highlight cells in green if the price is rising and in red if it is dropping. We shall also add icons indicating current trend. To highlight cells with red and green colors we can subscribe to Grid.RowUpdated event that occurs upon every notification from INotifyPropertyChanged interface.
grid.RowUpdated += delegate(object sender, GridRowUpdateEventArgs e)
{
    Feeder feeder = (Feeder) e.Row.DataObject;
    if (e.DataField != null && feeder != null)
    {
        Color color = grid.Highlighting.Color;
        TimeSpan duration = grid.Highlighting.Interval;

        switch (e.DataField.Id)
        {
            case Feeder.FieldLast:
            case Feeder.FieldLastQty:
                color = feeder.PrevLast < feeder.Last ? Color.FromArgb(128, Color.Green) : Color.FromArgb(128, Color.Red);
                break;

            case Feeder.FieldChange:
                double value = (double) e.Row[e.DataField.Id].Value;
                color = Color.FromArgb(128, value > 0 ? Color.DarkGreen : Color.DarkRed);
                break;


            case Feeder.FieldState:
                FeederState state = (FeederState) e.Row[e.DataField.Id].Value;
                color = (Equals(FeederState.Ok, state))
                            ? Color.FromArgb(128, Color.DarkGreen)
                            : Color.FromArgb(128, Equals(FeederState.Nok, state) ? Color.DarkRed : Color.DarkOrange);
                break;

            case Feeder.FieldBid:
            case Feeder.FieldBidQty:
            case Feeder.FieldAsk:
            case Feeder.FieldAskQty:
            case Feeder.FieldVolume:
            case Feeder.FieldHi:
            case Feeder.FieldLow:
                color = Color.FromArgb(128, Color.Orange);
                duration = TimeSpan.FromMilliseconds(500);
                break;
        }

        e.Row[e.DataField.Id].Highlight(duration, color);
    }
}
To change color of individual cells or to add icons we shall subscribe to Grid.PaintCell event.
grid.PaintCell += delegate(object sender, PaintCellEventArgs e)
{
    Feeder feeder = e.Cell.Row != null ? (Feeder) e.Cell.Row.DataObject : null;
    if (e.Cell.Column != null && feeder != null)
    {
        switch (e.Cell.Column.Id)
        {
            case Feeder.FieldBid:
            case Feeder.FieldBidQty:
                PaintHelper.AlphaBlend(e.Appearance, Color.FromArgb(20, Color.DarkRed));
                break;

            case Feeder.FieldAsk:
            case Feeder.FieldAskQty:
                PaintHelper.AlphaBlend(e.Appearance, Color.FromArgb(20, Color.DarkGreen));
                break;

            case Feeder.FieldLast:
                PaintHelper.AlphaBlend(e.Appearance, Color.FromArgb(20, Color.DarkBlue));
                e.Image = feeder.PrevLast < feeder.Last ? Resources.arrow_up_green : (feeder.PrevLast > feeder.Last ? Resources.arrow_down_red : null);
                e.ImageSettings.Alignment = ContentAlignment.MiddleLeft;
                break;

            case Feeder.FieldLastQty:
                PaintHelper.AlphaBlend(e.Appearance, Color.FromArgb(20, Color.DarkBlue));
                break;

            case Feeder.FieldChange:
                double v = (double) e.Cell.Value;
                PaintHelper.AlphaBlend(e.Appearance, v > 0 ? Color.FromArgb(128, Color.DarkGreen) : (v < 0 ? Color.FromArgb(128, Color.DarkRed) : Color.Transparent));
                break;

            case Feeder.FieldHi:
            case Feeder.FieldLow:
            case Feeder.FieldVolume:
                PaintHelper.AlphaBlend(e.Appearance, Color.FromArgb(30, Color.Orange));
                break;

            case Feeder.FieldState:
                e.Text = string.Empty;
                e.Image = Equals(FeederState.Ok, e.Cell.Value)
                              ? Resources.bullet_ball_glass_green
                              : (Equals(FeederState.Nok, e.Cell.Value) ? Resources.bullet_ball_glass_red : Resources.bullet_ball_glass_yellow);

                break;
        }
    }
}
After implementation of changes the application will look as shown below:
It would be good to add a history of price changes for every instrument and proportion between sell and buy offers for instruments. This feature will enable end users to have more comprehensive view of information and to make the right decisions quickly.
grid.PaintCell += delegate(object sender, PaintCellEventArgs e)
{
Feeder feeder = e.Cell.Row != null ? (Feeder) e.Cell.Row.DataObject : null;
if (e.Cell.Column != null && feeder != null)
{
switch (e.Cell.Column.Id)
{
...
case Feeder.FieldHistory:
e.PaintBackground();
e.Parts &= e.Parts ^ PaintPart.Background;
DrawHistory((IList<double>)e.Cell.Value, e.Cell.VirtualBounds, e.Graphics);
break;
case "Orders":
e.PaintBackground();
e.Parts &= e.Parts ^ PaintPart.Background;
DrawOrders(feeder.BidQty, feeder.AskQty, e.Cell.VirtualBounds, e.Graphics);
break;
}
}
}
private static void DrawHistory(IList<double> list, Rectangle bounds, Graphics graphics)
{
if (list != null && list.Count > 0 && bounds.Height > 0)
{
double min = 0;
double max = 0;
foreach (double d in list)
{
min = min > 0 ? Math.Min(min, d) : d;
max = Math.Max(max, d);
}
double vRatio = (max - min) / bounds.Height;
List<Point> points = new List<Point>();
for (int i = 0; i < list.Count; ++i)
{
double v = list[i];
int dy = (vRatio > 0 ? (int)((v - min) / vRatio) - 1 : bounds.Height / 2);
dy = Math.Max(0, dy);
int y = bounds.Y + dy;
int x = bounds.Right - ((i + 1) * bounds.Width / Feeder.MaxHistoryLength);
if (points.Count == 0)
{
points.Add(new Point(bounds.Right, y));
}
points.Add(new Point(x, y));
}
using (Pen p = new Pen(Color.Blue))
{
graphics.DrawLines(p, points.ToArray());
}
}
}
private static void DrawOrders(long bid, long ask, Rectangle bounds, Graphics graphics)
{
using (Pen pRed = new Pen(Color.Red, 1))
using (Pen pGreen = new Pen(Color.Green, 1))
{
if (bid > 0 || ask > 0)
{
int xMid = (int)(bounds.Width * ((double)ask) / (bid + ask));
graphics.DrawLine(pGreen, new Point(bounds.X, bounds.Y + 3), new Point(bounds.Left + xMid - 1, bounds.Y + 3));
graphics.DrawLine(pRed, new Point(bounds.Left + xMid, bounds.Y + 3), new Point(bounds.Right - 1, bounds.Y + 3));
xMid = Math.Max(xMid, 3);
xMid = Math.Min(xMid, bounds.Width - 3);
Point[] pp = {
new Point(bounds.Left + xMid, bounds.Y + 3),
new Point(bounds.Left + xMid - 4, bounds.Y + 10),
new Point(bounds.Left + xMid + 4, bounds.Y + 10)
};
graphics.FillPolygon(xMid < bounds.Width / 2 ? Brushes.Red : Brushes.Green, pp);
}
}
}
For grouped rows we shall also add display of state as icon. We shall display the number of elements that have the same state and change background color of the grouped row.
grid.PaintGroupRow += delegate(object sender, PaintGroupRowEventArgs e)
{
    int count = e.Row.Children.Count;
    int visibleCount = e.Row.VisibleChildren.Count;

    e.Text += count != visibleCount
                  ? string.Format(", Total instruments: {0}/{1}", visibleCount, count)
                  : string.Format(", Total instruments: {0}", count);


    if (e.Value is FeederState)
    {
        e.Appearance.GradientEnabled = true;
        e.Appearance.GradientDirection = GradientDirection.Vertical;

        switch ((FeederState)e.Value)
        {
            case FeederState.Ok:
                e.Appearance.BackColor = Color.FromArgb(212, 247, 232);
                e.Appearance.GradientEndBackColor = Color.FromArgb(167, 239, 211);
                e.Image = Resources.bullet_ball_glass_green;
                break;
            case FeederState.PartialOk:
                e.Appearance.BackColor = Color.FromArgb(247, 232, 212);
                e.Appearance.GradientEndBackColor = Color.FromArgb(239, 211, 167);
                e.Image = Resources.bullet_ball_glass_yellow;
                break;
            case FeederState.Nok:
                e.Appearance.BackColor = Color.FromArgb(247, 212, 232);
                e.Appearance.GradientEndBackColor = Color.FromArgb(239, 167, 211);
                e.Image = Resources.bullet_ball_glass_red;
                break;
        }
    }
}
Finally we shall install a theme that will draw the grid similarly to standard Microsoft controls:
public CAC40Control()
{
    InitializeComponent();

    ...
    grid.Theme = Theme.Default;
}
The example with displaying data changing in real-time is completed.
Before moving to the next example we shall note some things:
This example clearly separates application business logic from presentation of this logic in controls.
Business logic has been built using composite object that don't impact data volume and help to avoid data duplication in different classes. Let's note that Market class also has its state that can be modified. If this class implements InotifyPropertyChanged interface, all changes will be displayed in the grid even if market is part of a composite object.
The grid receives all notifications from non-GUI thread and performs synchronization and processes notifications in the main thread. This is true both for INotifyPropertyChanged and IBindingList interfaces. Let's note that Provider class uses threadsafe implementation of BindingList<T> to store collection. This means that when we add or remove market or instrument to/from collection, the grid automatically displays changes.
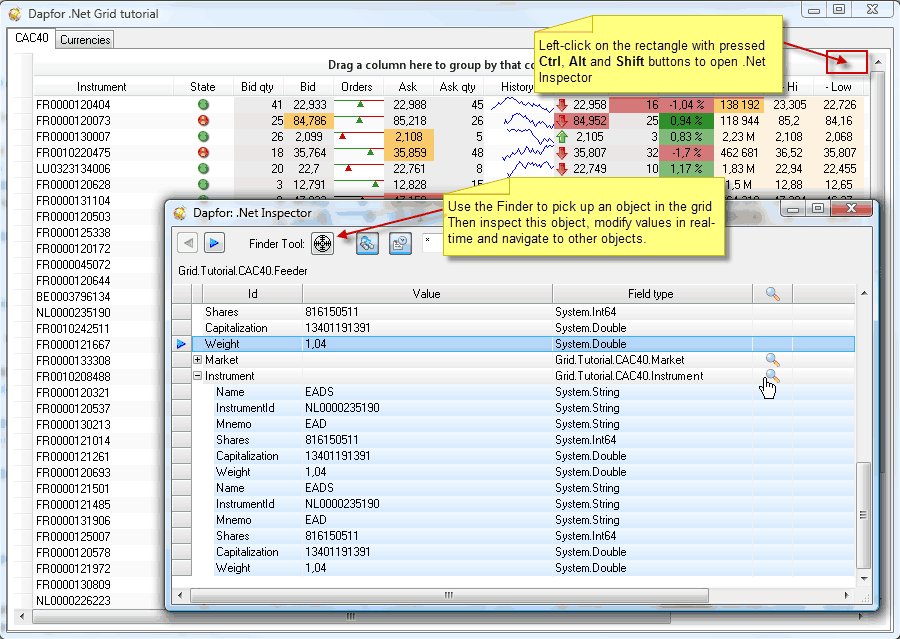
The last note is related to application debugging. Dapfor's library provides a powerful .Net Inspector tool that enables inspecting and editing application business logic without stopping it at breakPoints. Below we provide a small code sample that demonstrates use of this debugging feature.
grid.MouseClick += delegate(object sender, MouseEventArgs e)
{
    Rectangle rc = new Rectangle(grid.ClientRectangle.Width - 20, 0, 20, 20);
    if (rc.Contains(e.Location) &&
        Equals(e.Button, MouseButtons.Left) &&
        Equals(ModifierKeys, Keys.Control | Keys.Alt | Keys.Shift))
    {
        InspectorForm inspector = new InspectorForm();
        inspector.Show(grid);
    }
};